Environmental Dashboard
- Hits: 6227
- 1 Comment
- Subscribe to updates
- Bookmark
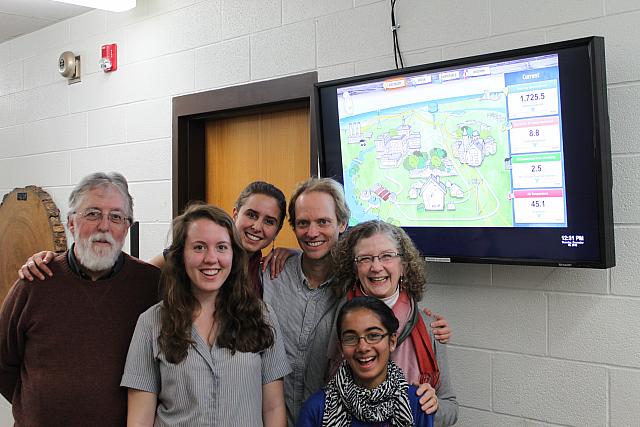
Technology to display video has come a long way since its start in the 1800’s. From analog to digital, VHS to BluRay, and even as you look at your computer, how we receive information (and entertainment) via a screen has changed drastically in order to make a more informed society. But are we informed about the right things in all the right places? While information about the world continues to grow and become more easily accessible, how about what’s happening in Tappan Square this weekend? Or what is my favorite local business doing on the sustainability front? How is the electricity and water I use daily moving through the City of Oberlin? With the launch of the new Environmental Dashboard at Prospect Elementary School and the Oberlin Public Library, this information will be more accessible and relevant to Oberlinians than ever.
Now, you, as I did, may be wondering what Environmental Dashboard really means. As stated in the mission statement by John Petersen, one of the developers of the technology, the “Environmental Dashboard is a set of technologies and approaches for monitoring, displaying and sharing information about environmental stewardship in our community. This website brings together real-time information on environmental conditions and water and electricity flows through buildings through the city. It combines these with the ideas, actions and images shared by community members. The goal is to engage, celebrate and empower positive action.” While there appears to be many goals in this one statement, it all boils down to education and community. The dashboards are displayed on digital signs that will display the water and electricity use in buildings, as well as the city as a whole. Along with the physical signs, the information will also be accessible online on the interactive dashboard website. These tools help the owners of the dashboard be able to monitor their usage and make changes accordingly. Also, there will be messaging content displaying how people in various aspects of our community, such as schools, businesses, organizations, and public areas, are engaged in environmental stewardship. Lastly, there will be information relevant to the particular location of the dashboard and an events calendar detailing what is happening in the Oberlin area.
Currently, there are now three dashboard locations within the community: Slow Train Cafe, the Oberlin Public Library, and Prospect Elementary School. Though an elementary school seems like an unlikely venue for one of these screens, the installation of dashboard technology in Prospect is occurring together as part of a joint effort between the Oberlin City School District, the Oberlin Project, and the Michigan-based firm “Creative Change Educational Solutions” to enhance the focus on sustainability as part of the International Baccalaureate (IB) curriculum employed in the Oberlin City School District. Creative Change Educational Solutions, based in Michigan, is an organization recognized as a national leader in sustainability education. They have worked with many teachers and students in order to develop new opportunities for them to learn and lead in the sector of environmental stewardship. The teachers of Prospect are now using the knowledge they’ve obtained to work on materials that can used in the curriculum, including ways to incorporate the Environmental Dashboard.
One other thing that is also accomplished by the dashboard is the connection it makes to the community. As one student from Oberlin College who assisted in the development of messaging content stated, “By engaging Prospect students directly in message development, we hope to nurture their interest in environmental issues and, more specifically, resource conservation.” Hearing the voices of our upcoming generation and of the current one, I find, is a motivating force to bring people together in one common goal. It doesn’t take hearing from too many people to realize the Oberlin community’s dedication to resilience and sustainability in all of its various forms. Below are just some of the voices that were heard in the development of messaging content:
Every voice in unison, whether young or old, is ringing out to recognize what we are already doing as groups and individuals in a push for a more green, vibrant community. And, through the usage of the newly established Environmental Dashboards, the diverse community of Oberlin will be able to hear them and respond with their own. From this, we will be able to collaborate together, rather than individually, in a way that you wouldn’t think possible with your average display.
Want to see the Environmental Dashboard in action and more messaging like the ones shown above? Check out the one of the ones located outside of Slow Train or at the Oberlin Public Library to experience it yourself! Or visit the Dashboard website, www.oberlindashboard.org.




You guys are doing a great job! -Jenny Hirsch